The relative performance of C and Rust
My blog post on falling in love with Rust got quite a bit of attention – with many being surprised by what had surprised me as well: the high performance of my naive Rust versus my (putatively less naive?) C. However, others viewed it as irresponsible to report these performance differences, believing that these results would be blown out of proportion or worse. The concern is not entirely misplaced: system benchmarking is one of those areas where – in Jonathan Swift’s words from three centuries ago – “falsehood flies, and the truth comes limping after it.”
There are myriad reasons why benchmarking is so vulnerable to leaving truth behind. First, it’s deceptively hard to quantify the performance of a system simply because the results are so difficult to verify: the numbers we get must be validated (or rejected) according to the degree that they comport with our expectations. As a result, if our expectations are incorrect, the results can be wildly wrong. To see this vividly, please watch (or rewatch!) Brendan Gregg’s excellent (and hilarious) lightning talk on benchmarking gone wrong. Brendan recounts his experience dealing with a particularly flawed approach, and it’s a talk that I always show anyone who is endeavoring to benchmark the system: it shows how easy it is to get it totally wrong – and how important it is to rigorously validate results.
Second, even if one gets an entirely correct result, it’s really only correct within the context of the system. As we succumb to the temptation of applying a result more universally than this context merits – as the asterisks and the qualifiers on a performance number are quietly amputated – a staid truth is transmogrified into a flying falsehood. Worse, some of that context may have been implicit in that the wrong thing may have been benchmarked: in trying to benchmark one aspect of the system, one may inadvertently merely quantify an otherwise hidden bottleneck.
So take all of this as disclaimer: I am not trying to draw large conclusions about “C vs. Rust” here. To the contrary, I think that it is a reasonable assumption that, for any task, a lower-level language can always be made to outperform a higher-level one. But with that said, a pesky fact remains: I reimplemented a body of C software in Rust, and it performed better for the same task; what’s going on? And is there anything broader we can say about these results?
To explore this, I ran some statemap rendering tests on SmartOS on a single-socket Haswell server (Xeon E3-1270 v3) running at 3.50GHz. The C version was compiled with GCC 7.3.0 with -O2 level optimizations; the Rust version was compiled with 1.29.0 with --release. All of the tests were run bound to a processor set containing a single core; all were bound to one logical CPU within that core, with the other logical CPU forced to be idle. cpustat was used to gather CPU performance counter data, with one number denoting one run with pic0 programmed to that CPU performance counter. The input file (~30MB compressed) contains 3.5M state changes, and in the default config will generate a ~6MB SVG.
Here are the results for a subset of the counters relating to the cache performance:
| Counter | statemap-gcc | statemap-rust | %Δ |
| cpu_clk_unhalted.thread_p | 32,166,437,125 | 23,127,271,226 | -28.1% |
| inst_retired.any_p | 49,110,875,829 | 48,752,136,699 | -0.7% |
| cpu_clk_unhalted.ref_p | 918,870,673 | 660,493,684 | -28.1% |
| mem_uops_retired.stlb_miss_loads | 8,651,386 | 2,353,178 | -72.8% |
| mem_uops_retired.stlb_miss_stores | 268,802 | 1,000,684 | 272.3% |
| mem_uops_retired.lock_loads | 7,791,528 | 51,737 | -99.3% |
| mem_uops_retired.split_loads | 107,969 | 52,745,125 | 48752.1% |
| mem_uops_retired.split_stores | 196,934 | 41,814,301 | 21132.6% |
| mem_uops_retired.all_loads | 11,977,544,999 | 9,035,048,050 | -24.6% |
| mem_uops_retired.all_stores | 3,911,589,945 | 6,627,038,769 | 69.4% |
| mem_load_uops_retired.l1_hit | 9,337,365,435 | 8,756,546,174 | -6.2% |
| mem_load_uops_retired.l2_hit | 1,205,703,362 | 70,967,580 | -94.1% |
| mem_load_uops_retired.l3_hit | 66,771,301 | 33,323,740 | -50.1% |
| mem_load_uops_retired.l1_miss | 1,276,311,911 | 105,524,579 | -91.7% |
| mem_load_uops_retired.l2_miss | 69,671,774 | 34,616,966 | -50.3% |
| mem_load_uops_retired.l3_miss | 2,544,750 | 1,364,435 | -46.4% |
| mem_load_uops_retired.hit_lfb | 1,393,631,815 | 157,897,686 | -88.7% |
| mem_load_uops_l3_hit_retired.xsnp_miss | 435 | 526 | 20.9% |
| mem_load_uops_l3_hit_retired.xsnp_hit | 1,269 | 740 | -41.7% |
| mem_load_uops_l3_hit_retired.xsnp_hitm | 820 | 517 | -37.0% |
| mem_load_uops_l3_hit_retired.xsnp_none | 67,846,758 | 33,376,449 | -50.8% |
| mem_load_uops_l3_miss_retired.local_dram | 2,543,699 | 1,301,381 | -48.8% |
So the Rust version is issuing a remarkably similar number of instructions (within less than one percent!), but with a decidedly different mix: just three quarters of the loads of the C version and (interestingly) many more stores. The cycles per instruction (CPI) drops from 0.65 to 0.47, indicating much better memory behavior – and indeed the L1 misses, L2 misses and L3 misses are all way down. The L1 hits as an absolute number are actually quite high relative to the loads, giving Rust a 96.9% L1 hit rate versus the C version’s 77.9% hit rate. Rust also lives much better in the L2, where it has half the L2 misses of the C version.
Okay, so Rust has better memory behavior than C? Well, not so fast. In terms of what this thing is actually doing: the core of statemap processing is coalescing a large number of state transitions in the raw data into a smaller number of rectangles for the resulting SVG. When presented with a new state transition, it picks the “best” two adjacent rectangles to coalesce based on a variety of properties. As a result, this code spends all of its time constantly updating an efficient data structure to be able to make this decision. For the C version, this is a binary search tree (an AVL tree), but Rust (interestingly) doesn’t offer a binary search tree – and it is instead implemented with a BTreeSet, which implements a B-tree. B-trees are common when dealing with on-disk state, where the cost of loading a node contained in a disk block is much, much less than the cost of searching that node for a desired datum, but they are less common as a replacement for an in-memory BST. Rust makes the (compelling) argument that, given the modern memory hierarchy, the cost of getting a line from memory is far greater than the cost of reading it out of a cache – and B-trees make sense as a replacement for BSTs, albeit with a much smaller value for B. (Cache lines are somewhere between 64 and 512 bytes; disk blocks start at 512 bytes and can be much larger.)
Could the performance difference that we’re seeing simply be Rust’s data structure being – per its design goals – more cache efficient? To explore this a little, I varied the value of the number of rectangles in the statemap, as this will affect both the size of the tree (more rectangles will be a larger tree, leading to a bigger working set) and the number of deletions (more rectangles will result in fewer deletions, leading to less compute time).
The results were pretty interesting:
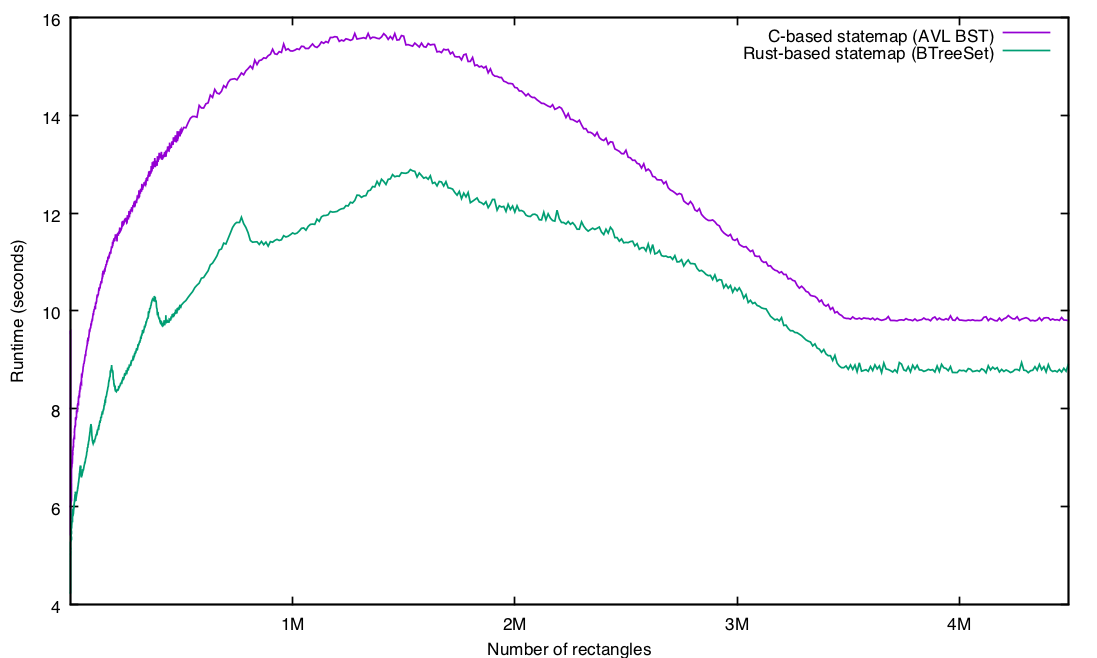
A couple of things to note here: first, there are 3.5M state transitions in the input data; as soon as the number of rectangles exceeds the number of states, there is no reason for any coalescing, and some operations (namely, deleting from the tree of rectangles) go away entirely. So that explains the flatline at roughly 3.5M rectangles.
Also not surprisingly, the worst performance for both approaches occurs when the number of rectangles is set at more or less half the number of state transitions: the tree is huge (and therefore has relatively poorer cache performance for either approach) and each new state requires a deletion (so the computational cost is also high).
So far, this seems consistent with the BTreeSet simply being a more efficient data structure. But what is up with that lumpy Rust performance?! In particular there are some strange spikes; e.g., zooming in on the rectangle range up to 100,000 rectangles:
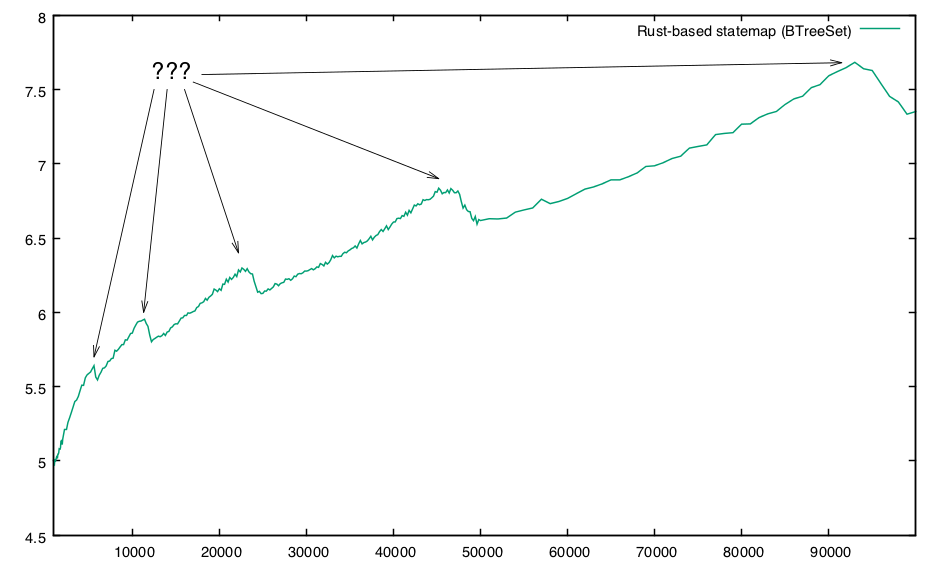
Just from eyeballing it, they seem to appear at roughly logarithmic frequency with respect to the number of rectangles. My first thought was perhaps some strange interference relationship with respect to the B-tree and the cache size or stride, but this is definitely a domain where an ounce of data is worth much more than a pound of hypotheses!
Fortunately, because Rust is static (and we have things like, say, symbols and stack traces!), we can actually just use DTrace to explore this. Take this simple D script, rustprof.d:
#pragma D option quiet

profile-4987hz
/pid == $target && arg1 != 0/
{
        @[usym(arg1)] = count();
}

END
{
        trunc(@, 10);
        printa("%10@d %A\n", @);
}
I ran this against two runs: one at a peak (e.g., 770,000 rectangle) and then another at the adjacent trough (e.g., 840,000 rectangles), demangling the resulting names by sending the the output through rustfilt. Results for 770,000 rectangles:
# dtrace -s ./rustprof.d -c "./statemap --dry-run -c 770000 ./pg-zfs.out" | rustfilt
3943472 records processed, 769999 rectangles
      1043 statemap`<alloc::collections::btree::map::BTreeMap<K, V>>::remove
      1180 statemap`<std::collections::hash::map::DefaultHasher as core::hash::Hasher>::finish
      1208 libc.so.1`memmove
      1253 statemap`<serde_json::read::StrRead<'a> as serde_json::read::Read<'a>>::parse_str
      1320 statemap`<std::collections::hash::map::HashMap<K, V, S>>::remove
      1695 libc.so.1`memcpy
      2558 statemap`statemap::statemap::Statemap::ingest
      4123 statemap`<std::collections::hash::map::HashMap<K, V, S>>::insert
      4503 statemap`<std::collections::hash::map::HashMap<K, V, S>>::get
     26640 statemap`alloc::collections::btree::search::search_tree
And now the same thing, but against the adjacent valley of better performance at 840,000 rectangles:
# dtrace -s ./rustprof.d -c "./statemap --dry-run -c 840000 ./pg-zfs.out" | rustfilt
3943472 records processed, 839999 rectangles
       971 statemap`<std::collections::hash::map::DefaultHasher as core::hash::Hasher>::write
      1071 statemap`<alloc::collections::btree::map::BTreeMap<K, V>>::remove
      1158 statemap`<std::collections::hash::map::DefaultHasher as core::hash::Hasher>::finish
      1228 libc.so.1`memmove
      1348 statemap`<serde_json::read::StrRead<'a> as serde_json::read::Read<'a>>::parse_str
      1628 libc.so.1`memcpy
      2524 statemap`statemap::statemap::Statemap::ingest
      2948 statemap`<std::collections::hash::map::HashMap<K, V, S>>::insert
      4125 statemap`<std::collections::hash::map::HashMap<K, V, S>>::get
     26359 statemap`alloc::collections::btree::search::search_tree
The samples in btree::search::search_tree are roughly the same – but the poorly performing one has many more samples in HashMap<K, V, S>::insert (4123 vs. 2948). What is going on? The HashMap implementation in Rust uses Robin Hood hashing and linear probing – which means that hash maps must be resized when they hit a certain load factor. (By default, the hash map load factor is 90.9%.) And note that I am using hash maps to effectively implement a doubly linked list: I will have a number of hash maps that – between them – will contain the specified number of rectangles. Given that we only see this at particular sizes (and given that the distance between peaks increases exponentially with respect to the number of rectangles), it seems entirely plausible that at some numbers of rectangles, the hash maps will grow large enough to induce quite a bit more probing, but not quite large enough to be resized.
To explore this hypothesis, it would be great to vary the hash map load factor, but unfortunately the load factor isn’t currently dynamic. Even then, we could explore this by using with_capacity to preallocate our hash maps, but the statemap code doesn’t necessarily know how much to preallocate because the rectangles themselves are spread across many hash maps.
Another option is to replace our use of HashMap with a different data structure – and in particular, we can use a BTreeMap in its place. If the load factor isn’t the issue (that is, if there is something else going on for which the additional compute time in HashMap<K, V, S>::insert is merely symptomatic), we would expect a BTreeMap-based implementation to have a similar issue at the same points.
With Rust, conducting this experiment is absurdly easy:
diff --git a/src/statemap.rs b/src/statemap.rs
index a44dc73..5b7073d 100644
--- a/src/statemap.rs
+++ b/src/statemap.rs
@@ -109,7 +109,7 @@ struct StatemapEntity {
     last: Option,                      // last start time
     start: Option,                     // current start time
     state: Option,                     // current state
-    rects: HashMap<u64, RefCell>,      // rectangles for this entity
+    rects: BTreeMap<u64, RefCell>,     // rectangles for this entity
 }

 #[derive(Debug)]
@@ -151,6 +151,7 @@ use std::str;
 use std::error::Error;
 use std::fmt;
 use std::collections::HashMap;
+use std::collections::BTreeMap;
 use std::collections::BTreeSet;
 use std::str::FromStr;
 use std::cell::RefCell;
@@ -306,7 +307,7 @@ impl StatemapEntity {
             description: None,
             last: None,
             state: None,
-            rects: HashMap::new(),
+            rects: BTreeMap::new(),
             id: id,
         }
     }
That’s it: because the two (by convention) have the same interface, there is nothing else that needs to be done! And the results, with the new implementation in light blue:
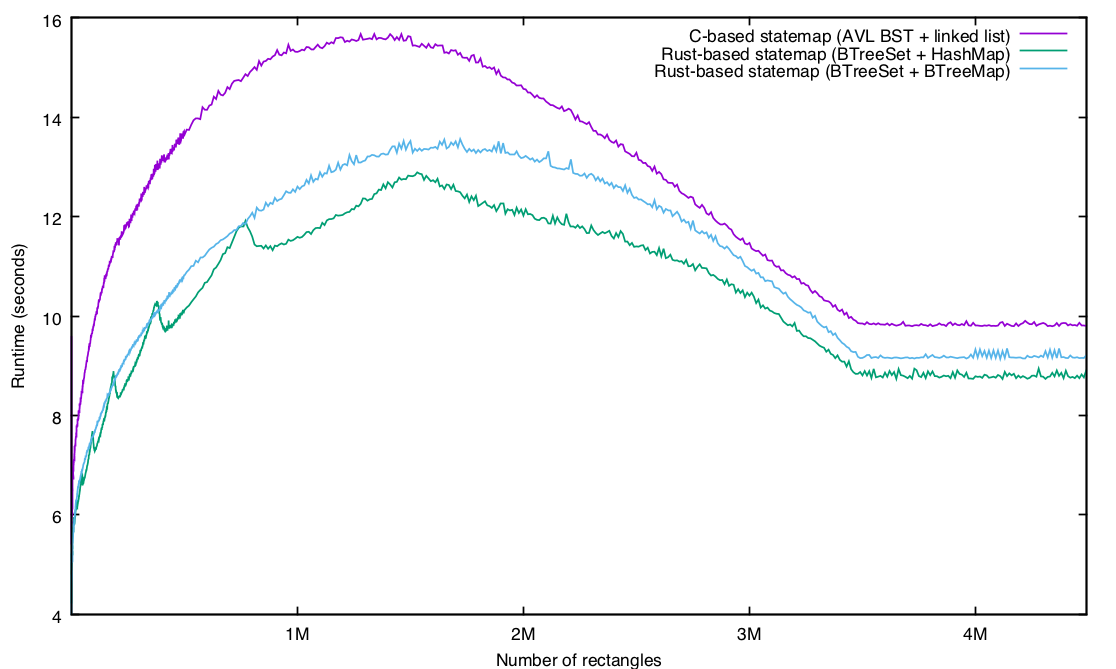
Our lumps are gone! In general, the BTreeMap-based implementation performs a little worse than the HashMap-based implementation, but without as much variance. Which isn’t to say that this is devoid of strange artifacts! It’s especially interesting to look at the variation at lower levels of rectangles, when the two implementations seem to alternate in the pole position:
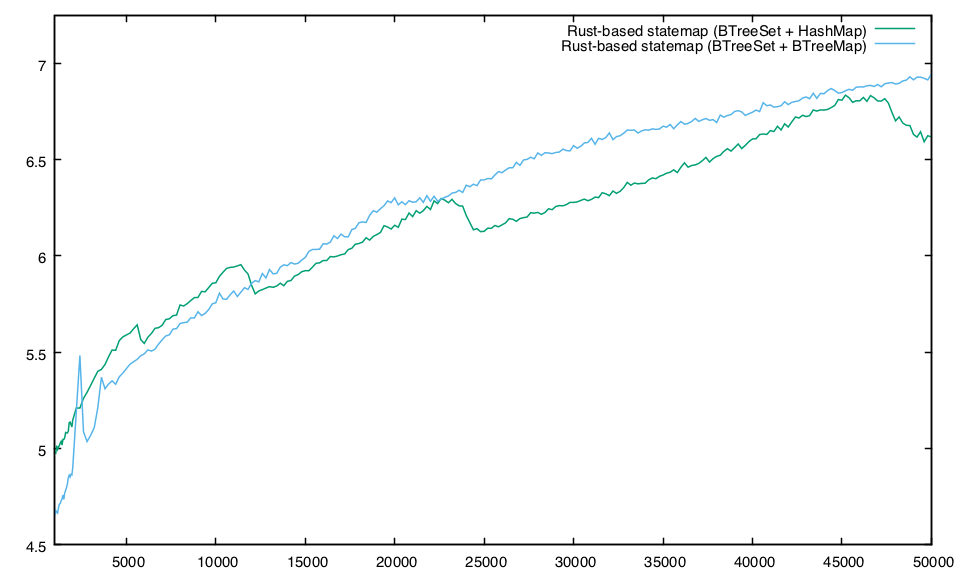
I don’t know what happens to the BTreeMap-based implementation at about ~2,350 rectangles (where it degrades by nearly 10% but then recovers when the number of rectangles hits ~2,700 or so), but at this point, the effects are only academic for my purposes: for statemaps, the default number of rectangles is 25,000. That said, I’m sure that digging there would yield interesting discoveries!
So, where does all of this leave us? Certainly, Rust’s foundational data structures perform very well. Indeed, it might be tempting to conclude that, because a significant fraction of the delta here is the difference in data structures (i.e., BST vs. B-tree), the difference in language (i.e., C vs. Rust) doesn’t matter at all.
But that would be overlooking something important: part of the reason that using a BST (and in particular, an AVL tree) was easy for me is because we have an AVL tree implementation built as an intrusive data structure. This is a pattern we use a bunch in C: the data structure is embedded in a larger, containing structure – and it is the caller’s responsibility to allocate, free and lock this structure. That is, implementing a library as an intrusive data structure completely sidesteps both allocation and locking. This allows for an entirely robust arbitrarily embeddable library, and it also makes it really easy for a single data structure to be in many different data structures simultaneously. For example, take ZFS’s zio structure, in which a single contiguous chunk of memory is on (at least) two different lists and three different AVL trees! (And if that leaves you wondering how anything could possibly be so complicated, see George Wilson’s recent talk explaining the ZIO pipeline.)
Implementing a B-tree this way, however, would be a mess. The value of a B-tree is in the contiguity of nodes – that is, it is the allocation that is a core part of the win of the data structure. I’m sure it isn’t impossible to implement an intrusive B-tree in C, but it would require so much more caller cooperation (and therefore a more complicated and more error-prone interface) that I do imagine that it would have you questioning life choices quite a bit along the way. (After all, a B-tree is a win – but it’s a constant-time win.)
Contrast this to Rust: intrusive data structures are possible in Rust, but they are essentially an anti-pattern. Rust really, really wants you to have complete orthogonality of purpose in your software. This leads you to having multiple disjoint data structures with very clear trees of ownership – where before you might have had a single more complicated data structure with graphs of multiple ownership. This clear separation of concerns in turn allows for these implementations to be both broadly used and carefully optimized. For an in-depth example of the artful implementation that Rust allows, see Alexis Beingessner’s excellent blog entry on the BTreeMap implementation.
All of this adds up to the existential win of Rust: powerful abstractions without sacrificing performance. Does this mean that Rust will always outperform C? No, of course not. But it does mean that you shouldn’t be surprised when it does – and that if you care about performance and you are implementing new software, it is probably past time to give Rust a very serious look!
Update: Several have asked if Clang would result in materially better performance; my apologies for not having mentioned that when I did my initial analysis, I had included Clang and knew that (at the default rectangles of 25,000), it improved things a little but not enough to approach the performance of the Rust implementation. But for completeness sake, I cranked the Clang-compiled binary at the same rectangle points:
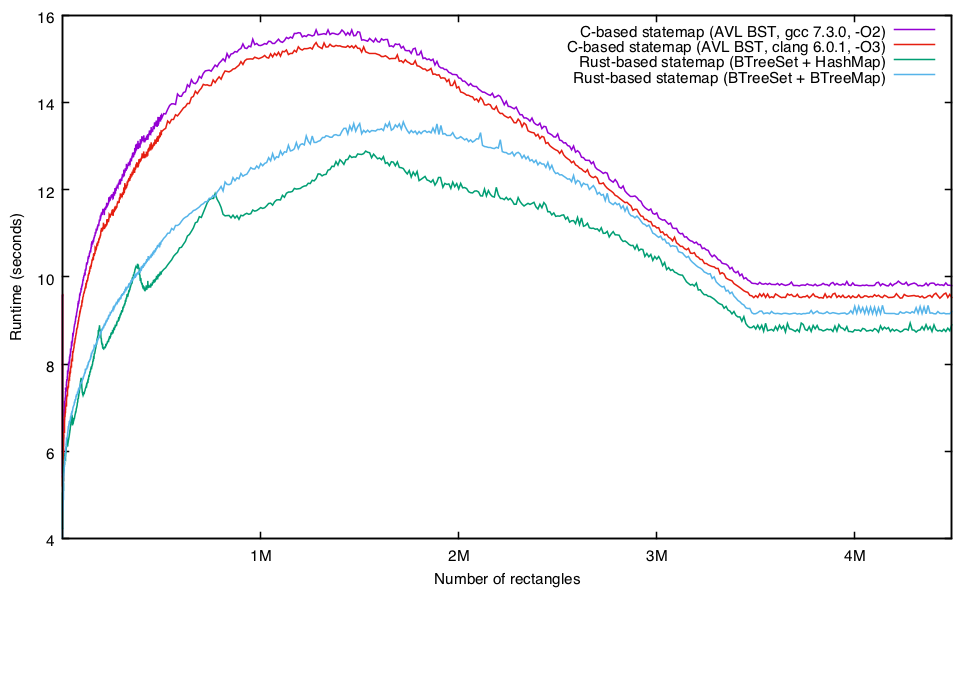
Despite its improvement over GCC, I don’t think that the Clang results invalidate any of my analysis – but apologies again for not including them in the original post!